
OUCH! – Exploration of the NEISS Dataset
The other day I found an interesting collection of data, which I immediately knew I wanted to take a closer look at. The collection is called the National Electronic Injury Surveillance System, or NEISS for short. NEISS gathers injury data from a representative sample of hospital emergency departments throughout the United States. Importantly, all the injuries reported in this data are related to some consumer product. While this may not sound exciting, this information provides a good glimpse into how people around the US are getting injured on a daily basis.
Starting with 2001, NEISS published a separate dataset for each calendar year. I downloaded the data for
the five-year period from 2015 to 2019 and combined it into one CSV file. I also downloaded data for
the year 2020, which I will analyze separately to look at the effect of the Coronavirus. Many of the variables in
this data are categorical, so they are numerically coded. I looked into the NEISS codebook and replaced these
numeric codes with the values that they actually respresent. A problem arose because there are over 1,000 different
codes for the numerous consumer products. Luckily, Hadley Wickham has created a package in R
called neiss. In this package, there is a dataset named products
which contains all these codes and their corresponding product names. Using the Python package
rpy2, I was able to run R in my Python environment. Then, I simply joined
this products dataset to my own neiss dataset.
import rpy2.robjects.packages as packages
import rpy2.robjects as ro
from rpy2.robjects import pandas2ri
from rpy2.robjects.conversion import localconverter
neiss = pd.read_csv('neiss.csv')
datasets = packages.importr('neiss')
products = packages.data(datasets).fetch('products')['products']
with localconverter(ro.default_converter + pandas2ri.converter):
  products = ro.conversion.rpy2py(products)
neiss = neiss.merge(products, left_on='Product_1', right_on='code')
I now have my dataset that I can start working with. And it’s a pretty large one!
neiss.shape

## (1841588, 26)neiss.columns
## Index(['CPSC_Case_Number', 'Treatment_Date', 'Year', 'Age', 'Sex', 'Race',
## 'Other_Race', 'Hispanic', 'Body_Part', 'Diagnosis', 'Other_Diagnosis',
## 'Body_Part_2', 'Diagnosis_2', 'Other_Diagnosis_2', 'Disposition',
## 'Location', 'Fire_Involvement', 'Alcohol', 'Drug', 'Narrative',
## 'Stratum', 'PSU', 'Weight', 'Product', 'Product_2', 'Product_3'],
## dtype='object')Each row represents someone’s trip to the hospital for an injury. For each one of these trips, we are given a good amount of information like the patient’s age, sex, what body part was injured, what the diagnosis was, a narrative describing how the patient was injured, and more.
So What’s Hurting Us?
First, I decided to find out what consumer products are actually sending people to the hospital most often. Each
row contains a Weight value that is used to obtain a national estimate of injuries. To obtain the
most dangerous products, I grouped the rows by their Product values and summed up these weights.
prod_top = pd.DataFrame(neiss.groupby('Product', as_index=False)['Weight'].sum())
           .sort_values(by='Weight', ascending=False).head(10)

sns.set_theme(style="whitegrid")
sns.set(font_scale = 1.5)
a4_dims = (11.7, 8.27)
fig = plt.subplots(figsize=a4_dims)
ax = sns.barplot(x="Weight", y="Product", data=prod_top, orient='h', palette='Greens_r_d')
ax.set_title('Top 10 Consumer Products Which Cause Injury', weight='bold', pad=15)
ax.set_ylabel('Consumer Product', weight='bold', labelpad=15)
ax.set_xlabel('National Estimate of Hospital Visits (in Millions)', weight='bold', labelpad=15)
ax.set_xticklabels(['0', '1', '2', '3','4', '5', '6'])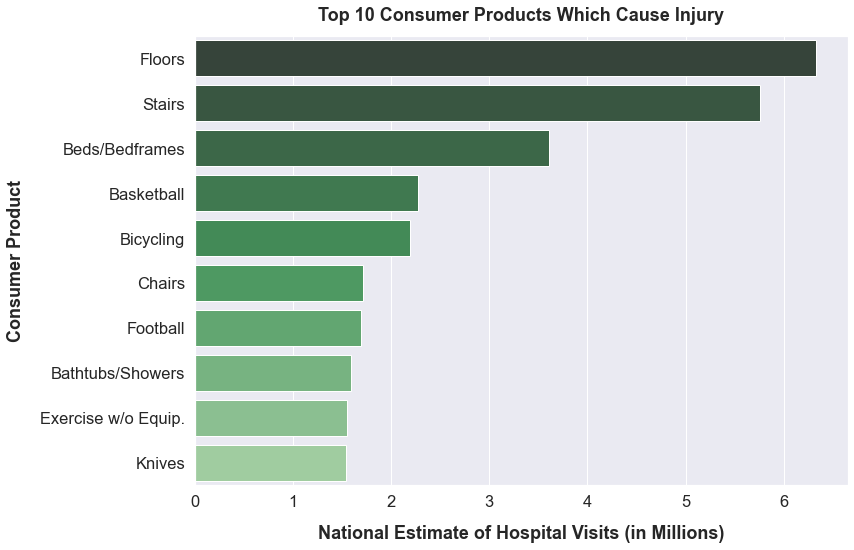
It looks like floors and stairs are the most dangerous things in our lives. Floors caused over 6 million injuries from 2015-2019, and stairs caused more than 5.5 million. I don’t know if I would have considered floors and stairs to be consumer products; however, the result makes sense. People tend to trip and fall a lot.
The one in the graph that caught my attention the most is basketball. I like to play basketball occasionally in my free time, so the fact that it is 4th on the list is somewhat disconcerting. I wanted to take a closer look at this result and see how severe the injuries caused by basketball actually were. To do this, I filtered the data to only look at injuries caused by basketball. I then determined what body parts were the most frequently injured in basketball and what diagnoses were most common.
bball = neiss.loc[neiss['Product']=='basketball (activity, apparel or equip.)']
bball_bodypart = pd.DataFrame(bball.groupby('Body_Part',
                  as_index=False)['Weight'].sum()).sort_values(by='Weight',
                  ascending=False).head(5)
bodypart = bball_bodypart['Body_Part']
bball = bball.loc[bball['Body_Part'].isin(bodypart)==True]
bball_diagnosis = pd.DataFrame(bball.groupby('Diagnosis', as_index=False)
                  ['Weight'].sum()).sort_values(by='Weight', ascending=False).head(7)
diagnosis = bball_diagnosis['Diagnosis']
bball.loc[~bball['Diagnosis'].isin(diagnosis), 'Diagnosis'] = 'Other/Not Stated'
bball_bodypart =  pd.DataFrame(bball.groupby(['Body_Part', 'Diagnosis'],
                  as_index=False)['Weight'].sum()).sort_values(by='Weight',
                  ascending=False)
bball_bodypart = bball_bodypart.loc[bball_bodypart['Body_Part'].isin(bodypart)==True]
bball_pivot = bball_pivot.pivot(columns='Diagnosis', index='Body_Part').fillna(0)

sns.color_palette("hls", 10)
bball_pivot.plot(kind='bar', stacked=True, legend=True)
plt.legend(loc=1, prop={'size': 9.5})
plt.title('Injuries Caused by Basketball', weight='bold', pad=15, fontsize=14)
plt.ylabel('National Estimate of Hospital Visits', weight='bold', labelpad=15, fontsize=12)
plt.xticks(rotation=45, ha="right")
plt.show()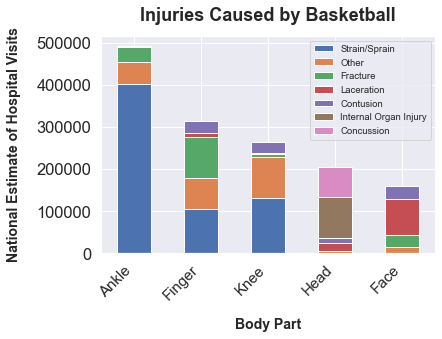
Luckily for me, the injuries do not appear to be too severe. Most injuries occur to the extremities like ankles and fingers. Also, apart from head injuries, the diagnoses appear relatively minor like sprains and fractures. In fact, there are more sprained ankles than the total number of injuries for any other body part. While no one ever wants to sprain an ankle, I don’t think I will let that stop me from playing a game of basketball every now and then.
Don’t Run with Scissors!
Growing up, every child probably heard a million times that they should never run with scissors. Parents and teachers have been warning children for generations that they can injure themselves or others if they are not careful when holding scissors. The idea is so prevalent that the phrase “running with scissors” has become an idiom for acting recklessly. With this dataset, I wanted to see if scissors truly deserved this reputation.
NEISS splits scissors into two different product categories, named “manual scissors” and “scissors, not specified.” Manual scissors are the everyday scissors that one pictures when thinking about scissors. “Scissors, not specified” was used when the scissors involved in the injury were not specifically identified as either manual or electric. However, when glancing at a sample of rows in the “scissors, not specified” group, all the injuries I saw were due to manual scissors and not electric ones. Therefore, I combined the “manual scissors” and “scissors, not specified” groups into one.
all_prod = pd.DataFrame(neiss.groupby('Product', as_index=False)['Weight'].sum())
scissor = all_prod.loc[(all_prod['Product']=='manual scissors') |
                   (all_prod['Product']=='scissors, not specified')]['Weight'].sum()
all_prod.loc[-1] = ['Scissors', scissor]
all_prod['Rank'] = all_prod['Weight'].rank(ascending=False)
all_prod.loc[all_prod['Product']=='Scissors']

##  Product	    Weight	    Rank
##	Scissors	96793.6992	117.0
With an estimate of a little less than 100,000 injuries in the 5-year span, scissors came in at 117th on the list of dangerous consumer products. For the amount we warn children about being careful with scissors, this seems pretty low. Much more mundane objects are higher on the list like paper products, clothing, and toilets (toilets are actually 18th on the list!).
While scissors do not seem to cause a large magnitude of hospital visits, it might be the case that they are more dangerous in the the hands of children. Adults know to be careful when using scissors since they are sharp, so they are not likely to be injured by scissors. Conversely, children may act more recklessly with scissors, leading to more injuries. To check this, I plotted the number of injuries caused by scissors against the age of the patients. Also, I plotted these results according to sex in order to see if males or females are more prone to scissor-related injuries.
scissors_codes = ['manual scissors', 'scissors, not specified']
scissors = neiss.loc[neiss['Product'].isin(scissors_codes)==True, :]
scissors_agesex = pd.DataFrame(scissors.groupby(['Age', 'Sex'], as_index=False)['Weight'].sum())

colors = {'Female':'hotpink', 'Male':'royalblue'}
ax = sns.lineplot(x='Age', y='Weight', data=scissors_agesex, hue='Sex', palette=colors)
ax.set_title('Scissor-Related Injuries by Age and Sex', weight='bold', pad=15)
ax.set_ylabel('National Estimate of Hospital Visits', weight='bold', labelpad=15)
ax.set_xlabel('Age', weight='bold', labelpad=15)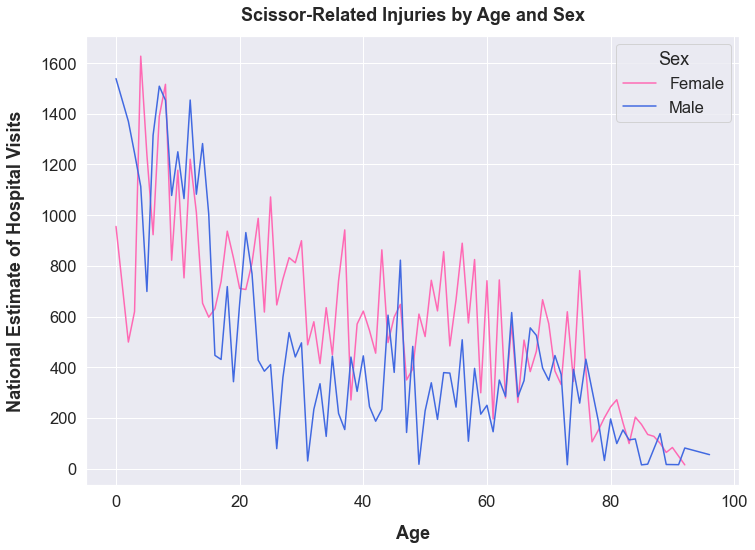
Maybe children should listen to their mothers more. The graph shows that children are indeed more likely to be injured from scissors. The number of injuries peaks with children and early adolescents. Then, it sharply declines once a person reaches early adulthood. Furthermore, there doesn’t seem to be a difference in the number of injuries among boys and girls of children age. Girls seem to be just as reckless as boys. However, once reaching adulthood, females are more prone to scissor-related injuries. I would guess that this means women handle scissors more often than men, leading to more injuries.
The next thing I decided to find out is where on the body children are getting hurt by scissors. Parents probably shouldn’t be too concerned if most of the injuries are minor like cuts on the hand. These injuries may leave a scar, but everyone probably has a few scars from his or her childhood. The big fear is that if children aren’t careful with scissors, they will injure themselves or someone else severely by poking an eye out or something similar. To check this, I first filtered the dataset to only include patients who were injured by scissors and were 10 years old or younger. Then, I grouped the scissor-related injuries by body part affected in order to see what parts of the body children are most often injuring with scissors.
sci_kids = scissors.loc[scissors['Age'] <= 10]
sci_kids_bodypart = pd.DataFrame(sci_kids.groupby(['Body_Part'], as_index=False)['Weight'].sum())
                                 .sort_values(by='Weight', ascending=False)
total = sci_kids_bodypart['Weight'].sum()
for ele in sci_kids_bodypart['Body_Part']:
    perc = (sci_kids_bodypart['Weight']/total * 100).round(2)
    sci_kids_bodypart['Treemap'] = sci_kids_bodypart['Body_Part'] + str('\n' ) + perc.astype(str) + '%'

import squarify
squarify.plot(sizes=sci_kids_bodypart['Weight'], label=sci_kids_bodypart['Treemap'], alpha=1,
              color=['salmon', 'lightgreen', 'silver', 'skyblue', 'khaki', 'mediumpurple',
                     'mediumaquamarine', 'tan', 'pink'])
plt.axis('off')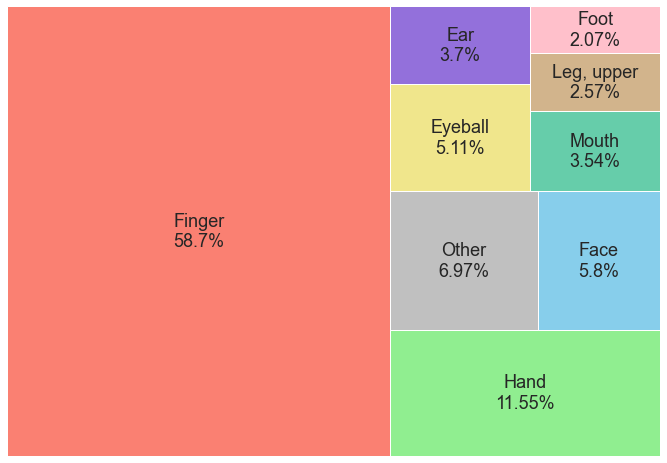
With finger and hand injuries making up about 70% of scissor-related injuries for children, it appears that most of the injuries are relatively minor. While no injury that leads to a hospital visit is a good thing, it is likely that these finger and hand injuries are not too severe. However, the next most common places to get hurt are the face, eye, ear, and mouth. These injuries in the head region are the ones that would scare any parent. In total, they comprise about 18% of the scissor-related injuries for children. That is not an insignificant amount.
After finding where on the body children are getting hurt with scissors, I checked to see how many
of these injuries involved running. To do this, I made use of the Narrative column in the dataset.
For each hospital visit, there is a short description of how the patient was injured. For example, here
are some of the descriptions for people injured by trash cans.
trashcan = neiss.loc[neiss['Product']=='waste containers, trash baskets or refus']
trashcan['Narrative'].head(3)

## 13 MO FEMALE FELL AND HIT MOUTH ON A TRASH CAN. DX LIP LACERATION

## 53YM WAS PUSHING THE GARBAGE DOWN IN THE GARBAGE CAN&CUT HAND ON
## SHARP OBJ >> LAC

## L62 YOM RESIDENT OF LOCAL NURSING HOME, FLIPPED OUT OF WHEELCHAIR;
## STRUCK HEAD ON TRASH CAN. LACERATION OF HEAD
To find the injuries involving running with scissors, I looked through this Narrative column for specific
substrings. In particular, I found any cases where the terms “ RUN” or “ RAN “ were present. This will filter
the dataset to only include cases where words like run, running, or ran were used to describe how the injury
occured. Obviously, this method is not perfect. If the doctor used a different word to describe running, my
filtering will miss it. However, for my personal project here, I think it is sufficient enough to get a general
glimpse of how often people are injuried running with scissors.
sci_run = scissors.loc[(scissors['Narrative'].str.contains(' RAN ')) |
                            (scissors['Narrative'].str.contains(' RUN'))]
sci_run.head(3)

## 8 YOF RUNNING WITH SCISSORS, JUMPED OVER RECLINER, FELL ONTO SCISSORS
## WITH MOUTH OPEN DX ORAL PW

## 3 YOF CUT RIGHT THUMB ON SCISSORS WHILE RUNNING AT HOME HOMEDX:
## LACERATION OF FINGER

## 25YOM PRESENTS C/O FOREARM INJURY GRABBED SCISSORS FROM HIS NIECE
## BECAUSE SHE WAS RUNNING W/ THEM AND ACCIDENTALLY FELL INJURING HIS
## LEFT ARM W/ THE SCISSORS. DX: LACERATION OF LEFT FOREARM
So there are indeed examples where people running with scissors have either injured themselves or injured others. But how common is it actually?
sci_run['Weight'].sum()/scissors['Weight'].sum()

## 0.006652132373508874
Based on NEISS estimates, less than 1% of all scissor-related injuries involve running. Either running with scissors isn’t as dangerous as we have been told or people actually listen to their mothers and make sure to not run with scissors. Is the result the same when only looking at the cases where the patient is a child 10 and under?
sci_run_kids = sci_kids.loc[(sci_kids['Narrative'].str.contains(' RAN ')) |
                            (sci_kids['Narrative'].str.contains(' RUN'))]
sci_run_kids['Weight'].sum()/sci_kids['Weight'].sum()

## 0.019238715684583386
Again, this result shows that injuries caused by running with scissors are not too common, even for children. Only about 2% of scissor-related injuries for children ten and under involve someone running. While this is not a large amount, it’s still almost 3 times higher than the result when looking at all ages.
In the end, scissors do not appear to be the deadly hazard that we are told as children. Children are much more likely to injure their finger while cutting with scissors than they are to poke their eye out while running with them. However, facial injuries do occur somewhat frequently with scissors, and this dataset also shows that there are instances of children getting hurt while running with them. Therefore, children should listen to their parents and not run with scissors!
The Corona Effect
2020 was a strange year for everyone due to the Coronavirus. The virus and the corresponding lockdowns affected many aspects of our lives. With the NEISS dataset, I wanted to see if one of these aspects was how people were getting injured.
The first thing to look at was whether there was a significant difference in the number of injuries in 2020
compared to other years. I appended the 2020 NEISS data to my neiss dataset. Then, I grouped the data
according to its year and summed the Weight value for each year.
neiss_2020 = pd.read_excel('Data\\NEISS_2020.XLSX')
neiss_corona = neiss.append(neiss_2020)
neiss_yrs = pd.DataFrame(neiss_corona.groupby('Year', as_index=False)['Weight'].sum())

labels = np.array(neiss_yrs['Year'])
colors = ['darkred' if (x == 2020) else 'darkgreen' for x in labels]
ax = sns.barplot(x="Year", y="Weight", data=neiss_yrs, palette=colors)
ax.set_title('Total Injuries by Year', weight='bold', pad=15)
ax.set_ylabel('National Estimate of Hospital Visits (in Millions)', weight='bold', labelpad=15)
ax.set_xlabel('Year', weight='bold', labelpad=15)
ax.set(yticklabels=['0', '2', '4', '6', '8', '10', '12', '14'])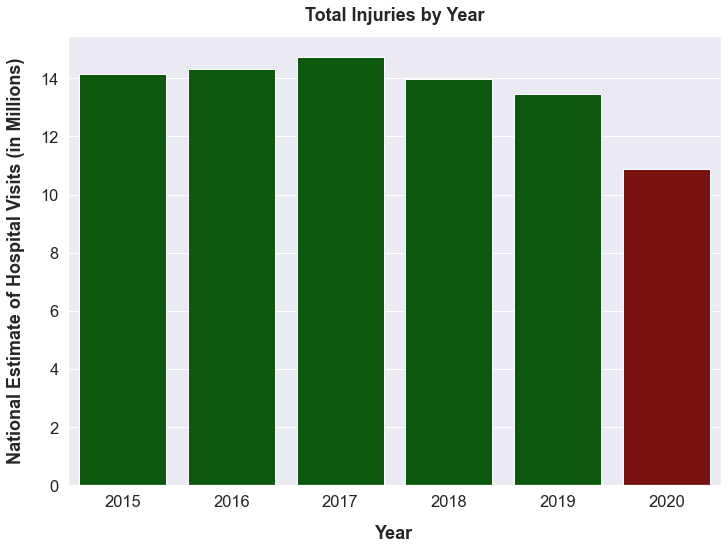
There were significantly less injuries in 2020 than in the previous 5 years. 2020 had about 2,500,000 less injuries than 2019, which was the year with the second-lowest number of injuries. A drop that large can not be attributed to mere chance. Clearly, the Coronavirus caused a big decrease in hospital visits caused by consumer products. Another interesting way to look at this decrease is when plotting the number of injuries against the months of the year.
neiss_corona['Month'] = pd.DatetimeIndex(neiss_corona['Treatment_Date']).month
neiss_months = pd.DataFrame(neiss_corona.groupby(['Year', 'Month'], as_index=False)['Weight'].sum())
neiss_2020['Month'] = pd.DatetimeIndex(neiss_2020['Treatment_Date']).month

mon = ['Jan', 'Feb', 'Mar', 'Apr', 'May', 'Jun', 'Jul', 'Aug', 'Sep', 'Oct', 'Nov', 'Dec']
colors = {2015:'blue', 2016:'green', 2017:'grey', 2018:'mediumorchid', 2019:'darkgoldenrod', 2020:'darkred'}
ax = sns.lineplot(x='Month', y='Weight', data=neiss_months, hue='Year', palette=colors)
ax2 = sns.lineplot(x='Month', y='Weight', data=neiss_2020_months,  color='darkred', linewidth=4)
ax2.get_legend().remove()
ax.set_title('Number of Injuries by Month', weight='bold', pad=15)
ax.set_ylabel('National Estimate of Hospital Visits', weight='bold', labelpad=20)
ax.set(ylim=(500000, 1500000))
ax.set_yticks([600000, 800000, 1000000, 1200000, 1400000])
ax.set_yticklabels(['600,000', '800,000', '1,000,000', '1,200,000', '1,400,000'])
ax.set_xlabel('Month', weight='bold', labelpad=15)
ax.set_xticks([1,2,3,4,5,6,7,8,9,10,11,12])
ax.set_xticklabels(mon)
leg = ax.legend(loc=4)
for line in leg.get_lines():
    line.set_linewidth(4.0)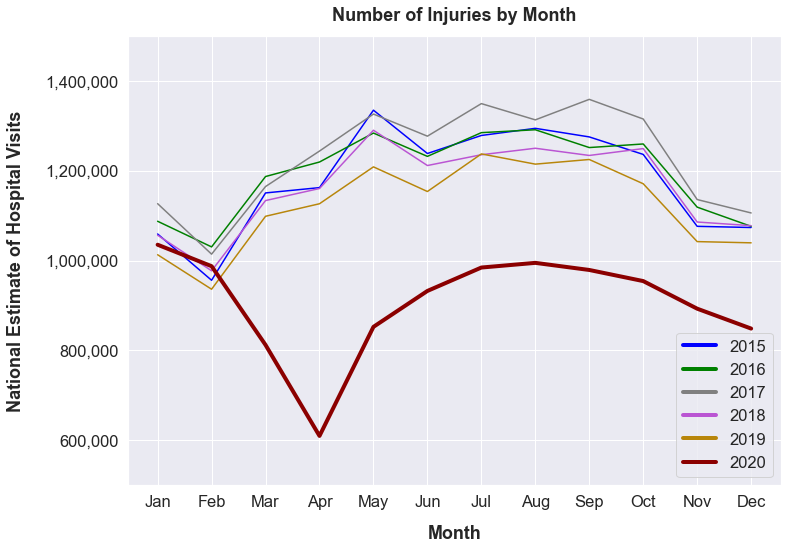
2020 started out with similar numbers to all the other years. While March sees an increase in injuries in regular years, there is a sharp decline in 2020. When looking back at the events of 2020, this result makes perfect sense. March is the month where the response to the pandemic really began in the US. Most states began their lockdowns in March. Since people stayed at home and practiced social distancing, they did not put themselves into situations that often lead to injury. For example, sports-related injuries are a major contributor to the total number of injuries. However, with gyms being closed and sports being canceled, sports-related injuries likely saw a significant reduction during lockdown, which led to a decline in the total number of injuries. The summer months of 2020 show an increase in injuries relative to March and April. I would guess that this corresponds to the time when some states began easing their lockdown restrictions. However, many states still had restrictions and many people were still cautious of the virus, so injury numbers in 2020 never reached the levels of the prior years.
The 2020 data also allowed me to determine which consumer products were the most affected by the Coronavirus. To do this, I just needed to find the difference in the number of injuries each product caused in 2020 compared to 2019. The products most affected by the Coronavirus are the products which had the largest percentage decrease from 2019 to 2020.
corona_products = pd.DataFrame(neiss_corona.groupby(['Year', 'Product'], as_index=False)['Weight'].sum())
years = [2019, 2020]
corona_products = corona_products.loc[corona_products['Year'].isin(years)==True]
corona_products = corona_products.pivot(index='Product', columns='Year')
corona_products.columns = ['2019 Injury Estimate', '2020 Injury Estimate']
corona_products['Yearly Difference'] = corona_products['2020 Injury Estimate'] - corona_products['2019 Injury Estimate']
corona_products['Percent Change'] = ((corona_products['Yearly Difference'] / corona_products['2019 Injury Estimate']) * 100).round(2)
corona_products = corona_products.loc[(corona_products['2019 Injury Estimate'] >= 4000) |
                                      (corona_products['2020 Injury Estimate'] >= 4000)]

biggest_drop = corona_products.sort_values('Percent Change').head(10)
plus = lambda x: '+'+str(x) if x>0 else x
biggest_drop['Percent Change'] = biggest_drop['Percent Change'].apply(plus)
biggest_drop['Percent Change'] = biggest_drop['Percent Change'].astype(str) + '%'
print(biggest_drop.to_markdown())| Product | 2019 Injury Estimate | 2020 Injury Estimate | Yearly Difference | Percent Change |
|---|---|---|---|---|
| Lacrosse | 13763.4 | 3634.11 | -10129.3 | -73.6% |
| Rugby | 8251.09 | 2361.74 | -5889.35 | -71.38% |
| Amusement Attractions | 27028.3 | 9519.28 | -17509 | -64.78% |
| Cheerleading | 29837.7 | 10532.3 | -19305.4 | -64.7% |
| Water Slides, Public | 5752.99 | 2047.03 | -3705.96 | -64.42% |
| Ball Sports (e.g. Dodgeball, Kickball, etc.) | 5978.79 | 2132.59 | -3846.2 | -64.33% |
| Track & Field | 26568.5 | 9680.99 | -16887.5 | -63.56% |
| Bleachers | 14310.7 | 5547.3 | -8763.35 | -61.24% |
| Monkey Bars or Other Playground Climbing | 72017.2 | 28824.4 | -43192.8 | -59.98% |
| Umbrellas | 4069.35 | 1712.89 | -2356.46 | -57.91% |
As I suspected, several sports saw severe drops in their number of injuries from 2019 to 2020. For instance, lacrosse is a spring sport whose season lasts from approximately the end of February to May. Basically, the entirety of the lacrosse season in 2020 was cancelled due to lockdowns. Rugby and track & field are also spring sports, which explains why these sports also had such large percentage decreases. Other than sports, the other type of products that saw significant decreases in injuries are ones related to public places. Amusement parks and playgrounds were likely closed for much of the year. If not closed, people still probably avoided them in order to minimize contact with others. This explains the decrease in amusement attraction, water slide, and monkey bar injuries. For people to get hurt on bleachers, there needs to be sporting events. Since sports games were either canceled or had no crowds, people were not able to trip and fall on the bleachers. The interesting one is umbrellas. People use umbrellas when they are outside and it is raining. My guess is that people used their umbrellas less in 2020 since many people didn’t have to commute to work and people weren’t going to places like bars. Less use of umbrellas led to less umbrella injuries.
While 2020 saw a significant drop in the total number of injuries, an interesting question to ask is whether some products saw significant increases in injuries caused. Instead of seeing which products had the largest percentage decrease in injuries from 2019 to 2020, I just had to reverse it and see which ones had the largest percentage increase.
biggest_gain = corona_products.sort_values('Percent Change', ascending=False).head(10)
print(biggest_gain.to_markdown())| Product | 2019 Injury Estimate | 2020 Injury Estimate | Yearly Difference | Percent Change |
|---|---|---|---|---|
| Respiratory Protection Devices | 180.833 | 4352.16 | 4171.33 | +2306.73% |
| Outdoor Patio Heaters or Firepits | 3104.17 | 5703.51 | 2599.34 | +83.74% |
| Mountain or All-terrain Bicycles | 9261.11 | 15292.8 | 6031.73 | +65.13% |
| In-line Skating | 7869.12 | 12558.9 | 4689.77 | +59.6% |
| Fireworks | 9802.2 | 15009.2 | 5206.98 | +53.12% |
| Water Tubing | 5568.05 | 8072.1 | 2504.05 | +44.97% |
| Mopeds or Power-assisted Cycles | 21443.4 | 30570.5 | 9127.13 | +42.56% |
| Archery | 3259.55 | 4349.36 | 1089.81 | +33.43% |
| Portable Circular Power Saws | 8323.68 | 10055.2 | 1731.57 | +20.8% |
| Paints or Varnishes | 7656.42 | 9228.75 | 1572.32 | +20.54% |
The eye-catching one is also the least surprising one. Injuries due to respiratory protection devices saw a massive 2,300% increase from 2019 to 2020. This is because this category includes masks and facial coverings. No one really wore them before this year, and now everyone has been wearing them. Even though there hasn’t been too many injuries caused by masks, there were virtually none before this year, so any increase will cause a large percentage increase.
When looking at the other products on the chart, they all seem easily explainable. Outdoor heaters were also more frequently used in 2020. Many restaurants used outdoor heaters to accommodate for outdoor dining, and many people bought them for their homes so they could sit outside while stuck at home for the winter. Likely trying to cope with the boredom of the pandemic, people turned to firework. Firework sales in 2020 leading up to July 4th were much greater than in previous years. The rest of the items in that chart seemed to be caused by people having too much free time in 2020. All this free time led some people to pick up new hobbies. I imagine activites like mountain biking, in-line skating, archery, etc. saw an increase in participants in 2020. An increase in participants leads to an increase in injuries. Other people used their free time to tackle some DIY projects like painting. These DIY projects often require tools like power saws which can easily cause injuries when mishandled.
As shown above, 2020 saw a significant decrease in total injuries compared to prior years. However, this decrease in injuries may not be as large as the data suggests. NEISS uses hospital visits as a surrogate for total number of injuries. This makes sense because when people get injured, they go to the hospital. 2020 presents an unusual situation though. Worried about overcrowded hospitals and the risk of exposure to the Coronavirus, it is possible that people tried to avoid the hospital in 2020. Therefore, the number of injuries in 2020 may have not actually decreased as significantly as the data shows. Instead, people may have treated minor injuries at home. These minor injuries would have sent them to the hospital in a normal year but not in 2020.
It is not possible to really prove this idea since I do not have data on people self-treating injuries within their homes. Nevertheless, I can use the NEISS data to see if there is some evidence of this self-treating occuring. If injuries actually decreased considerably in 2020, one would expect this decrease to be uniform across all injury severities. This means that the number of hospitilzations for not only minor injuries but also for major injuries would have decreased. However, if people were avoiding the hospital in 2020, one would expect the number of hospitilzations for minor injuries to have decreased but not the number of hospitilzations for major injuries. Major injuries require hospitilzation and can not be substituted with self-treatment.
To check this, I grouped the data by diagnosis and year. Then, I compared the number of injuries per diagnosis between 2019 and 2020.
corona_diagnosis = pd.DataFrame(neiss_corona.groupby(['Year', 'Diagnosis'], as_index=False)['Weight'].sum())
years = [2019, 2020]
corona_diagnosis = corona_diagnosis.loc[corona_diagnosis['Year'].isin(years)==True]
corona_diagnosis = corona_diagnosis.pivot(index='Diagnosis', columns='Year')
corona_diagnosis.columns = ['2019 Injury Estimate', '2020 Injury Estimate']
corona_diagnosis['Yearly Difference'] = corona_diagnosis['2020 Injury Estimate'] - corona_diagnosis['2019 Injury Estimate']
corona_diagnosis['Percent Change'] = ((corona_diagnosis['Yearly Difference'] / corona_diagnosis['2019 Injury Estimate']) * 100).round(2)

biggest_drop = corona_diagnosis.sort_values('Percent Change').head()
print(biggest_drop.to_markdown())| Diagnosis | 2019 Injury Estimate | 2020 Injury Estimate | Yearly Difference | Percent Change |
|---|---|---|---|---|
| Strain or Sprain | 1.61266e+06 | 1.05631e+06 | -556345 | -34.5% |
| Dermatitis, Conjunctivitis | 105871 | 70978.7 | -34892.5 | -32.96% |
| Concussions | 226752 | 159205 | -67547.3 | -29.79% |
| Contusions, Abrasions | 1.80206e+06 | 1.27126e+06 | -530802 | -29.46% |
| Crushing | 30778.2 | 22421.5 | -8356.74 | -27.15% |
The chart above shows the five diagnoses that had the largest percentage decrease in number of injuries from 2019 to 2020. I would say at least three of those diagnoses are not very severe. Strains, dermatitis, and contusions are all relatively minor injuries that can likely be treated at home without any serious repercussions.
smallest_drop = corona_diagnosis.sort_values('Percent Change', ascending=False).head()
print(smallest_drop.to_markdown())| Diagnosis | 2019 Injury Estimate | 2020 Injury Estimate | Yearly Difference | Percent Change |
|---|---|---|---|---|
| Amputation | 23313.9 | 24734.5 | 1420.59 | +6.09% |
| Poisoning | 138497 | 142198 | 3700.61 | +2.67% |
| Ingested foreign object | 85558.5 | 80414 | -5144.54 | -6.01% |
| Thermal Burns | 98224.6 | 89632.6 | -8592.08 | -8.75% |
| Laceration | 2.16555e+06 | 1.97569e+06 | -189862 | -8.77% |
In contrast, the injuries which did not see as significant percentage decreases were more severe injuries. Things like thermal burns and poisoning can not be treated at home. People can not avoid the hospital when an injury of that severity occurs.
The fact that minor injuries saw greater percentage decreases than more major injuries suggests to me that people did avoid the hospital in 2020. Some people who may have opted to go to a hospital for an injury in a regular year decided to treat the injury at home in 2020. This provides evidence that hospital visitations decreased in 2020 more than the actual number of injuries decreased. I still think that the number of injuries decreased by a significant amount in 2020. Of the 30 different diagnoses that NEISS uses, only amputation and poisoning saw an increase in the number of injuries from 2019 to 2020. However, the decrease in actual injuries may be less than what the NEISS data suggests.
This is the end of my exploration of the NEISS dataset, but there is a lot more that can be done with it.
I did not even touch the Race or Location columns in this project. Using only these two columns, one could possibly
find out if different races are more or less likely to be injured in a public place like school. Or
someone who is interested in text analysis could probably make good use of the Narrative column. This really is a fun dataset
that can provide the answers to a ton of different questions.
Some of the coding blocks above have been edited for clarity and readability. The entirety of my code is available here.